
The question
An annual ranking can combine infrastructure, traffic exposure and what happened in earlier years. This study asks how much strictly prior-year incident-report history adds when the rest of the model is held fixed.
The primary comparison uses the same histogram gradient-boosting specification with and without history features. It evaluates incremental information in this setting, rather than introducing a new algorithm or testing the causal effect of changing a crossing.
Building an annual view of the data
The source material is public FRA inventory revisions and incident reports, frozen in the September 6, 2026 release. Each year uses the latest unambiguous full inventory revision dated strictly before January 1. Eligible crossings are recorded as open, public and at grade; all recorded crossing purposes are retained.
The complete 2014–2025 panel contains 1,526,612 crossing-years across 138,245 distinct crossings. A positive crossing-year has at least one joined incident report. This outcome does not count verified, deduplicated physical accidents, and a missing report is not proof that no incident occurred.
History features include prior one-, three- and five-year report counts, time since the last observed report, and prior casualty totals. The outcome year is excluded from those windows. History updates annually, so a 2025 row can use 2024 reports.
A chronological comparison
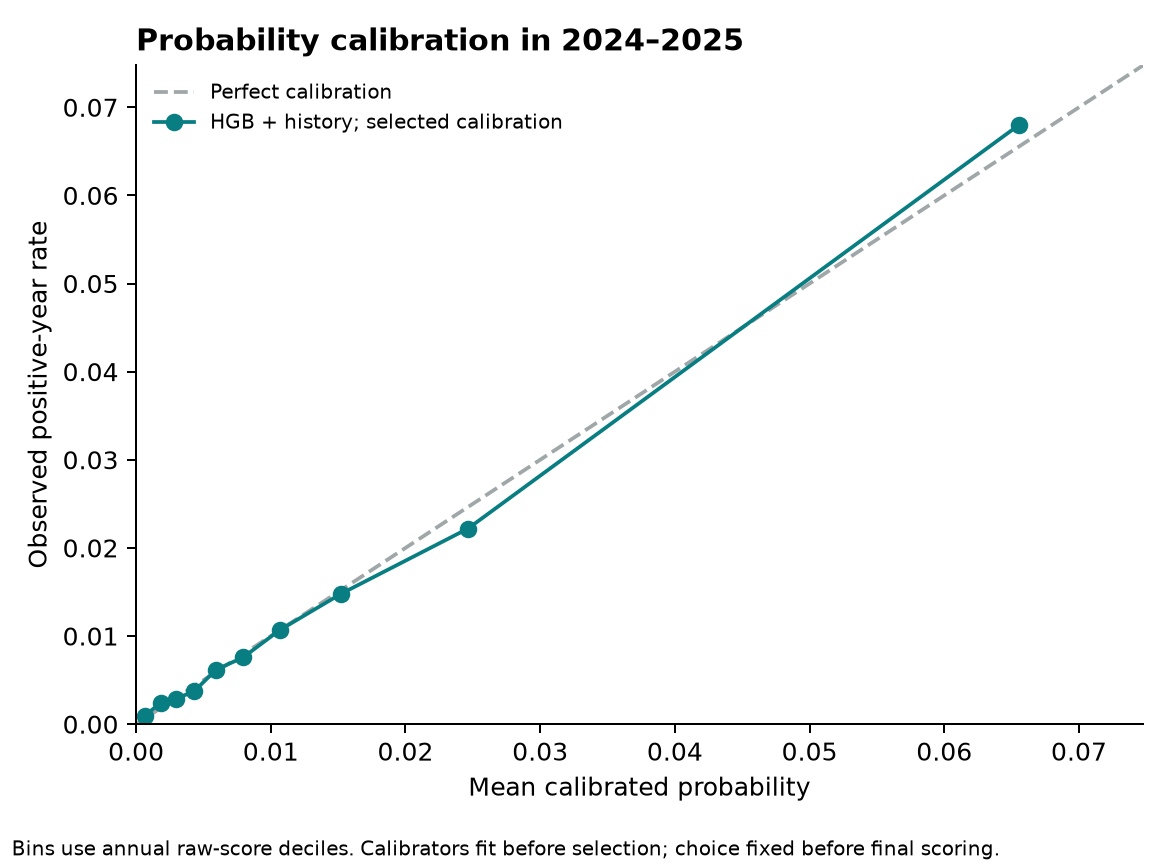
Models are fitted on 2014–2021. Probability calibrators are fitted on 2022, selected using 2023 Brier score, and evaluated on 2024–2025. All six models share the same rows. Final-test labels do not select the calibration method.
The final evaluation includes 251,028 crossing-years and 3,498 positive crossing-years, an occurrence rate of 1.39%. Raw model scores determine ranking; selected calibrated probabilities are evaluated separately.
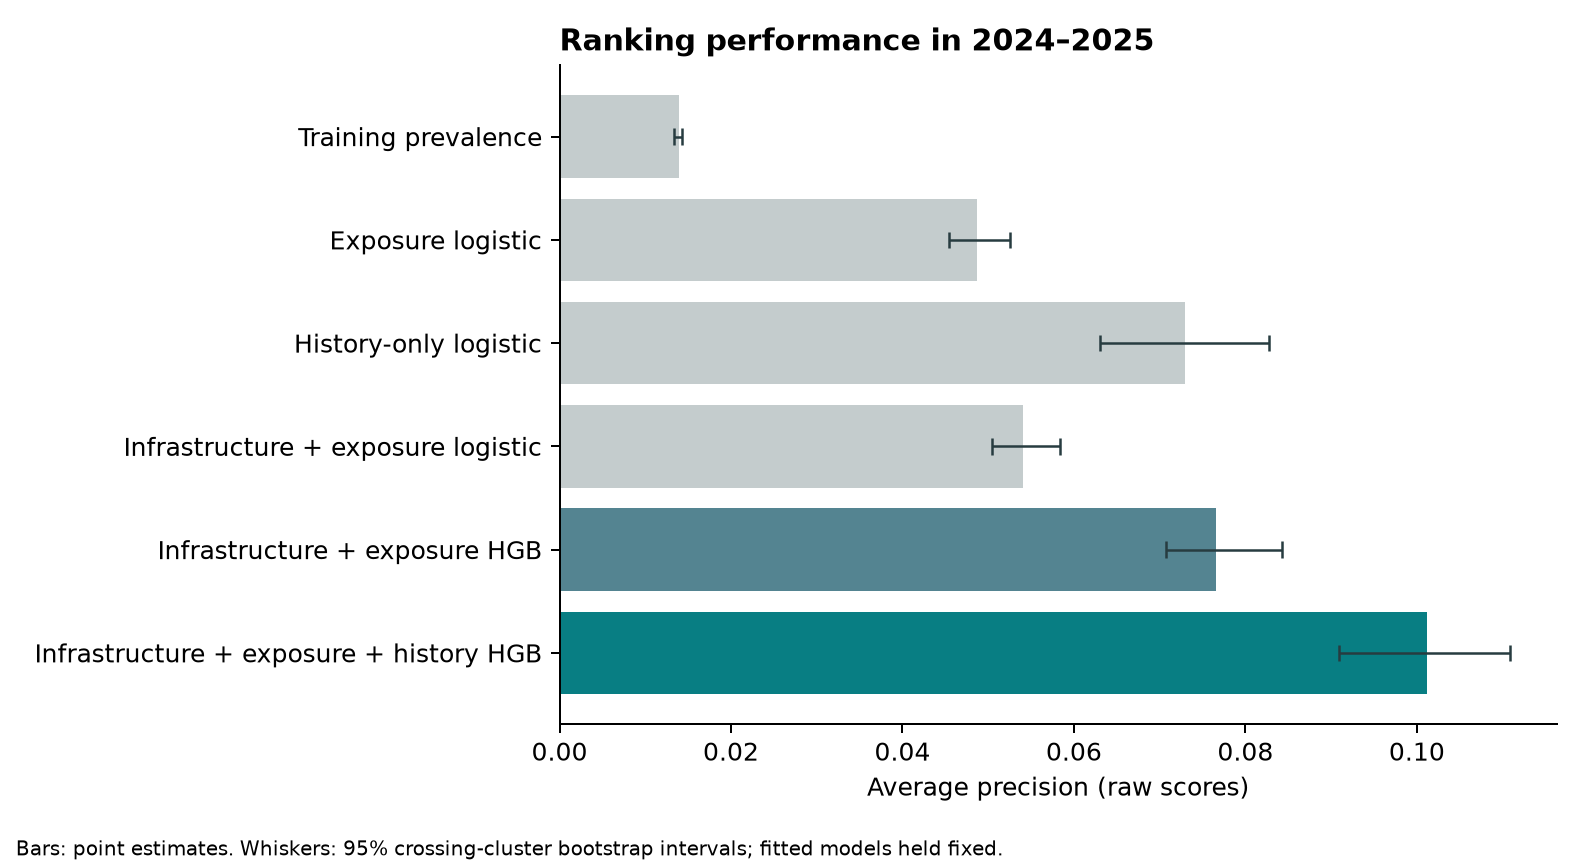
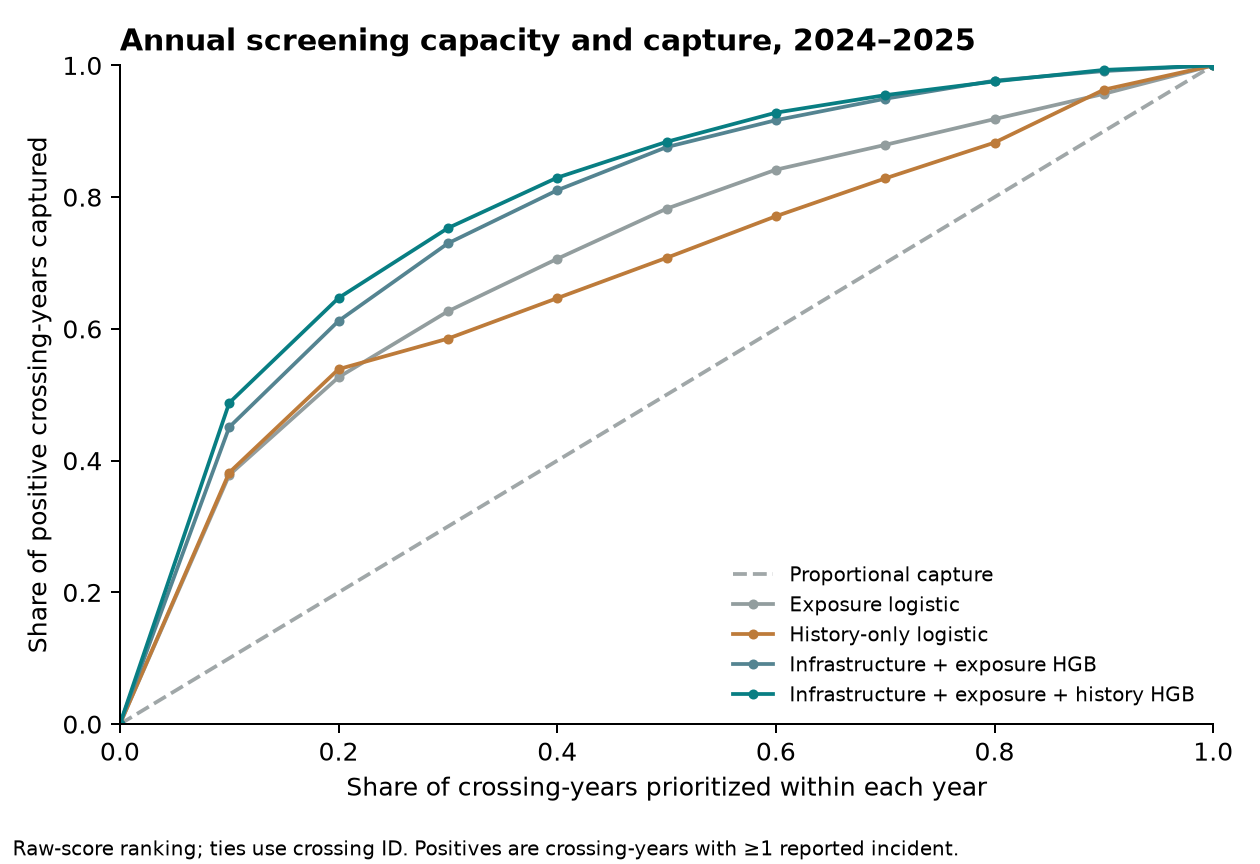
Average precision is the primary ranking metric. Brier score measures probability error. Capacity capture asks what share of positive crossing-years falls within the highest-ranked 10% of crossings in each year.
What the release found
Adding history to the infrastructure/exposure boosted-tree model increased average precision from 0.0766 to 0.1012. The paired difference was +0.0246, with a 95% crossing-cluster bootstrap interval of +0.0167 to +0.0316.
The highest-ranked 10% captured 48.8% of positive crossing-years with history, compared with 45.1% without it. The difference was 3.7 percentage points, with a 95% interval of 2.3 to 4.9 percentage points.
These are retrospective ranking results. Capture refers to positive crossing-years, not the number of incidents prevented.
| Model | Average precision | Brier score | Top-10% capture |
|---|---|---|---|
| Training prevalence | 0.0139 | 0.01374 | 10.0% |
| Exposure logistic | 0.0487 | 0.01350 | 37.8% |
| History-only logistic | 0.0729 | 0.01330 | 38.2% |
| Infrastructure + exposure logistic | 0.0541 | 0.01346 | 37.9% |
| Infrastructure + exposure HGB | 0.0766 | 0.01329 | 45.1% |
| Infrastructure + exposure + history HGB | 0.1012 | 0.01312 | 48.8% |
Scroll the table sideways for Brier score and capture.
What the results do not establish
Revision-date reconstruction cannot establish what information was publicly available at a historical forecast date. Later corrections, reporting delays, missing earlier revisions and stale status can remain. This is the central limitation for any operational interpretation.
The bootstrap resamples whole crossings and retains their evaluation years together. Its intervals condition on fitted models; they do not include refitting, common temporal shocks, source uncertainty or spatial dependence between nearby crossings.
The exposure-only comparator is not the FRA APS/GXAPS operational framework. This study does not establish superiority to that system, geographic transfer, intervention effectiveness, operational readiness or publication novelty.
The release replaces the earlier exploratory results. Earlier capture headlines should not be reused as current findings.
Inspecting and reproducing the work
The research package records source queries and hashes, annual eligibility and join audits, the frozen panel, predictions, calibration selections, bootstrap replicates, figures and run manifests. The downloadable summary preserves the results and principal limitations of the September 6 release.
AI assistance supported implementation, methodological review and drafting. This is an independent portfolio study, not an external research appointment. External domain review of source timing, reporting conventions and the comparison design remains the next validation step.